Why You Should Use Power BI as Your Go-To Visualisation and Modelling Tool
- IssyHayes

- May 7
- 3 min read
Updated: May 19
Let's be honest.
You didn’t grow up dreaming about data models or bar charts.
Neither did I.
But here you are, knee-deep in spreadsheets, trying to make sense of 10,000 rows of chaos while your coffee goes cold.
You deserve better.
You deserve Power BI.
Here’s why Power BI isn’t just another flashy tool – it’s the sidekick you didn’t know you needed.

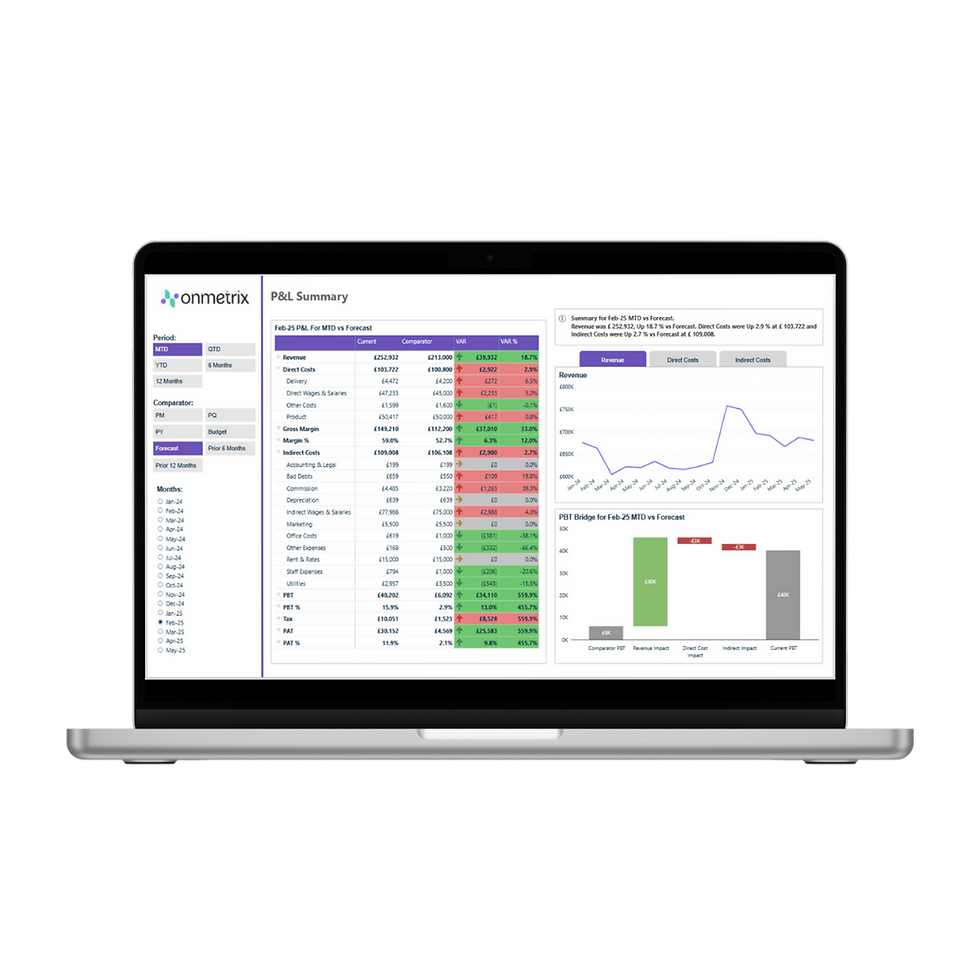
1. It Actually Makes Data Look Good
Most dashboards look like a bad 90s website: clunky, confusing, and more Comic Sans than anyone should be subjected to.
Power BI fixes that.
Drag and drop visuals that actually make sense
Crisp, clean, interactive charts that you can proudly show your boss (and your mum)
Endless customisation, without needing a degree in graphic design
You can finally turn that terrifying sales report into something that even Steve from Finance can understand on a Monday morning.
2. Modelling Without the Meltdown
Remember trying to build relationships between tables in Excel?
Yeah, me too.
It usually ended with a VLOOKUP tantrum and a lot of sighing.
Power BI treats data modelling like a grown-up:
You create relationships visually
You don’t need endless formulas
It shows you when things don’t quite add up
You can build star schemas, snowflakes (the data kind, not the "gets offended easily" kind), and organise your data properly.
It’s basically Marie Kondo-ing your datasets.
3. It Talks to (Almost) Everything
Power BI isn’t a snob.
It happily connects to:
Excel
SQL databases
Web APIs
Cloud platforms
SharePoint
Even that dusty old CSV file you've been avoiding
Whatever your data source, Power BI pulls it in like a hungry Labrador at dinnertime.
4. Powerful DAX for Those Who Like Feeling Clever
Want to feel like a wizard?Learn a bit of DAX (Data Analysis Expressions).
It sounds scary, but it’s just a fancy way of saying, "I can calculate stuff properly."
With DAX, you can:
Build KPIs
Create time intelligence measures (like YoY Growth, MoM Change)
Calculate dynamic targets
Make your dashboards do the hard thinking for you
Soon you'll be throwing around terms like "filter context" and "row context" at the pub.(Warning: You may clear the table.)
5. It Grows With You
Start simple.
A couple of charts, a slicer or two.
No judgement.
But when you’re ready to go big, Power BI is ready too:
Row-level security for different users
Paginated reports for the really serious stuff
Embedded analytics if you want to build apps
AI insights (without needing to understand AI)
It’s like going from building a LEGO house to constructing the Death Star — one dashboard at a time.
6. Everyone's Doing It (And They’re Hiring Too)
Companies love Power BI.A quick LinkedIn search shows thousands of jobs asking for it.
If you can:
Build a clean model
Create an engaging dashboard
Tell a simple story with data
You’re instantly more valuable.
You don't have to become a "Power BI Guru" or a "Data Jedi" (yes, those are actual job titles).
Just being competent already puts you ahead.
7. It Saves You From Death by PowerPoint
Instead of 50 slides no one reads, you can send a single, interactive dashboard.
Your colleagues can click around and get the answers they need without needing you to explain every line.
You free up your time, they stop pestering you, and everyone wins.
(Except maybe Barry, who always asks for a "quick tweak" at 4:55pm.)
Final Thoughts
Power BI isn’t magic.
You still have to think.
But it takes the heavy lifting out of data work.
You don’t need to be a tech genius.
You don’t need a £10,000 course.
You just need to be curious, organised, and willing to click a few buttons.
So next time you’re drowning in spreadsheets and battling pivot tables, ask yourself:"
Would Power BI make my life easier?"
(Answer: Yes. Always yes.)


Comments